A New Map of Old Albemarle (and Cville)
Users Guide
This is a modern map of historical things. It’s meant as a resource for local history researchers in Central Virginia and for curious residents who want to learn more about the history around us. All the data in this map was created from publicly available sources and is believed to be free from any copyright or usage restrictions.
Data Layers
This map is made up of a basemap (the “background image”) with multiple layers on top. Each layer represents a different theme, and you can turn layers on and off at any time. This map has the following layers:
Places: Current and historical place names pulled from official sources and historical maps.
Historical features: Farms, houses, mills, churches, schools and other features. Each location has the following data attributes:
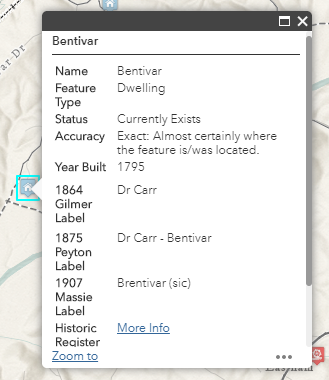
- Current and historical names of the feature.
- Whether or not it still exists. (Note: the map uses transparency to indicate this status. Solid icons mean the feature still exists, while transparency indicates the feature is no longer there.)
- The approximate years it was built and removed (if known).
- The accuracy level of the location.
- Labels if the feature is included on one of four historical maps of Albemarle County. This makes it easy to match features on less accurate historical maps with modern, precise locations.
- Links to various additional data sources, including historical registers, Library of Congress (LOC) records, WPA historical inventory records from the Library of Virginia, or other misc. websites.
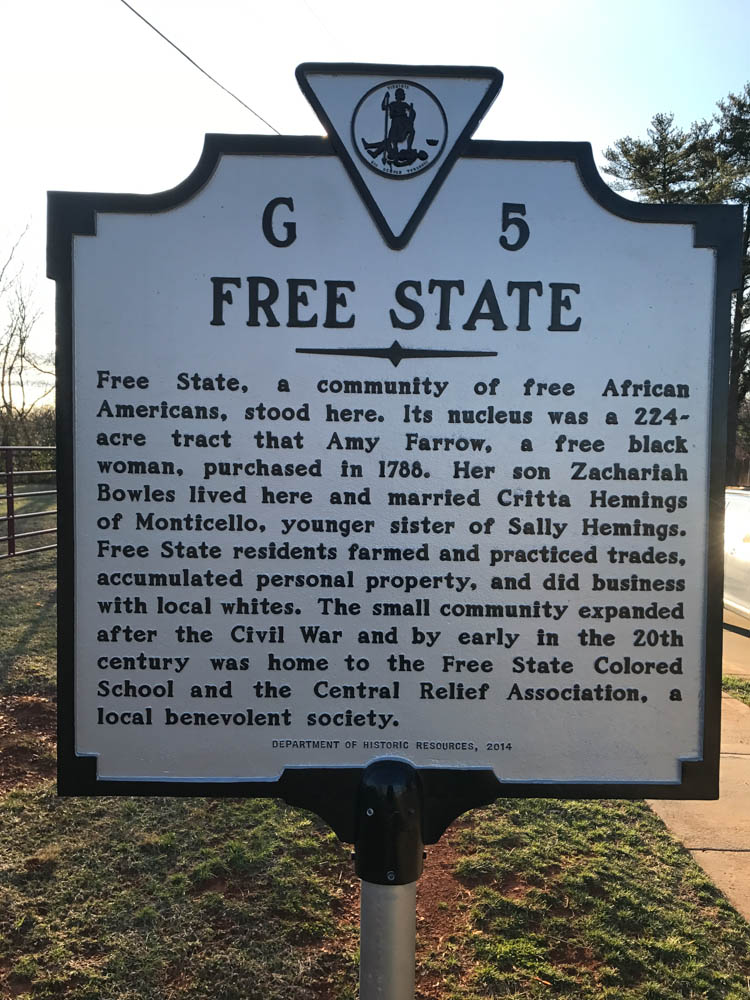
Historical markers: Photos of roadside history markers.
Current and historical roads: This layer was created using modern road data from OpenStreetMap and reconciled against historical maps going back to 1864. LiDAR data from the Virginia Geographic Information Network was used to map historical road traces. Each road segment has attributes that list which historical maps the road is found on. Features are divided into the following categories:
- Road: Indicates the feature is still a current road in use
- Road Trace / Road Path: In most cases these are road traces visible in the LiDAR data. In some limited cases the historical road bed is no longer present however the likely path of the road is obvious.
- Possible Road Path: These are features identified on a historical map but for which no trace is visible on LiDAR or current and historical aerial photos. These features represent a possible path based on the terrain. They can be thought of as “place holders” indicating that a road ran through a general area.
Current and historical railroads: Similar to the road layer, showing current (indicated with a white halo) and historical (gray halo) railroad locations.
Historical areas: These are historical neighborhoods and communities. Some are designated historical districts while others are less formal but no less important.
Aerial photos: Historical aerial photos covering all of Albemarle County and Charlottesville from 1937, 1957, 1966, 1974, 1980, and 1990. These are courtesy of the UVA Albert and Shirley Small Special Collections Library (SCL) and the UVA Scholars’ Lab. More information can be found at this link.
Maps of Albemarle and Charlottesville, including:
- Gilmer/Campbell’s 1864 map of Albemarle County (courtesy LOC)
- Hotchkiss’s 1867 map of Albemarle County (courtesy LOC)
- Peyton’s 1875 map of Albemarle County (courtesy LOC)
- Massie’s 1907 map of Albemarle County (courtesy UVA Albert and Shirley Small SCL)
- Charlottesville 1866, 1891, 1896, and 1907 Sanborn insurance maps (courtesy UVA Albert and Shirley Small SCL and Scholars’ Lab)
- Gray’s 1877 map of Charlottesville (courtesy David Rumsey map collection)
- Historical and recent topographic maps from the USGS
Note: The Gilmer, Hotchkiss, Peyton, and Massie maps were georeferenced (the process of associating each map with geographic coordinates) using a process called rubber sheeting. In some places you’ll notice visual distortion – these are areas where the map is less accurate and had to be stretched and warped to better align it with real-world locations. Although this makes the map less visually appealing it improves the spatial accuracy of the features shown on the map.
Using the Map


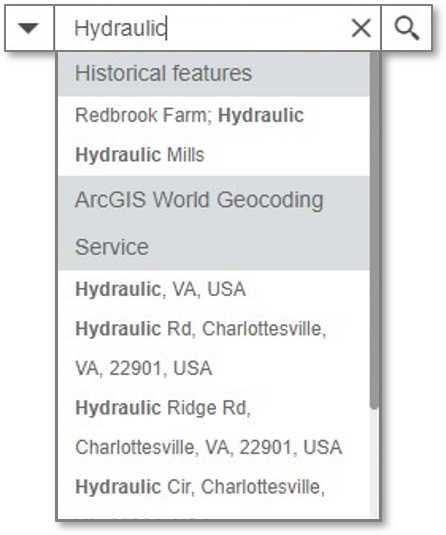
The search box in the top left corner can be used to search for place names, historic features, or modern addresses and locations. Some example searches might be “Hydraulic Mills”, “Gale Hill”, “Stony Point”, or “Shadwell”.
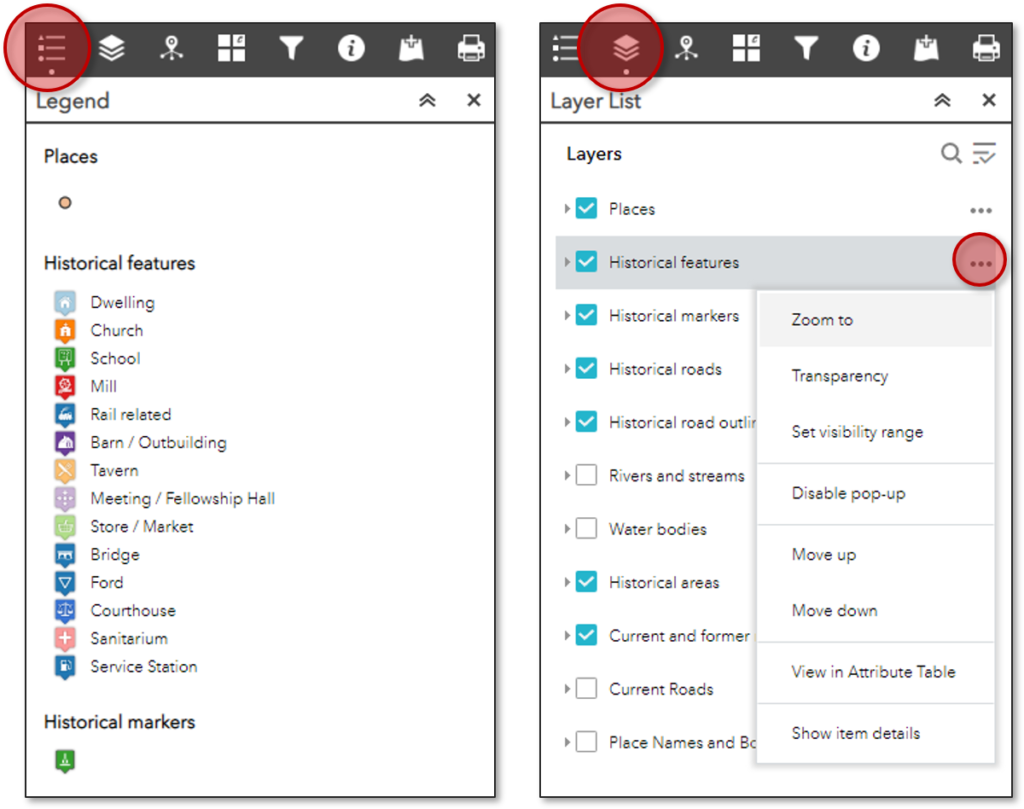
The legend and layer list widgets allow you to see an explanation of all the features on the map, as well as turn layers on and off, reorder them, and adjust transparency.
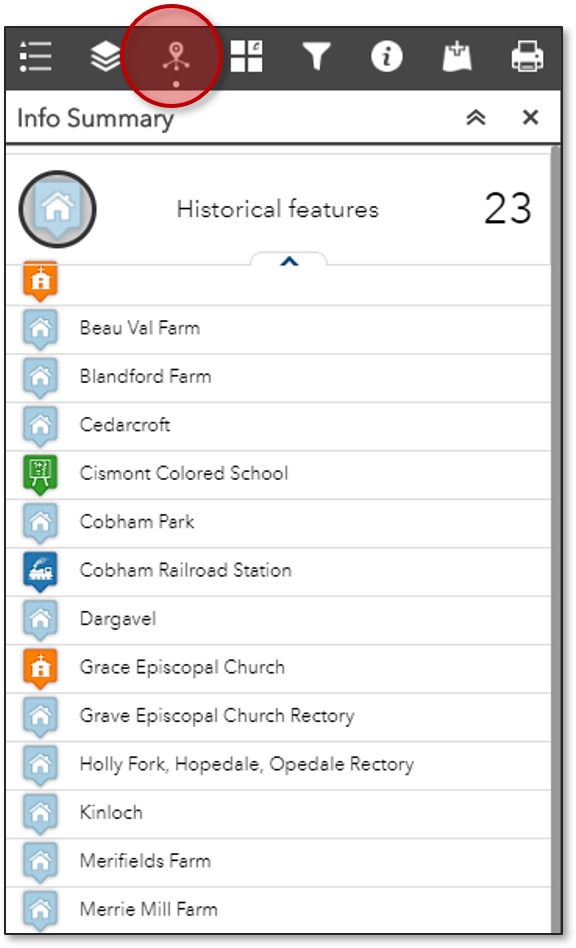
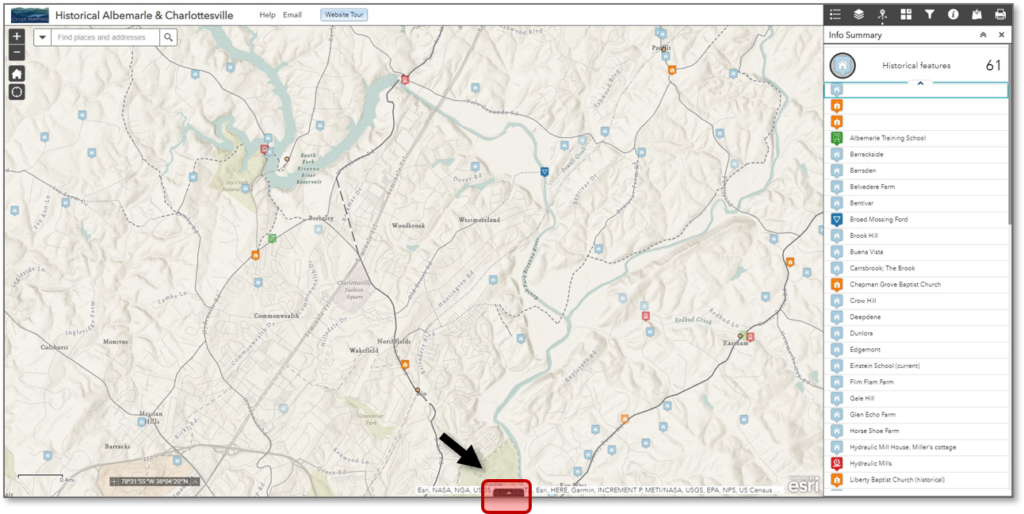
The info summary widget displays a list of all the features currently visible on the map. This is an easy way to see what’s in an area without having to click on numerous icons. Selecting an item in the list will open the feature’s popup window on the map.
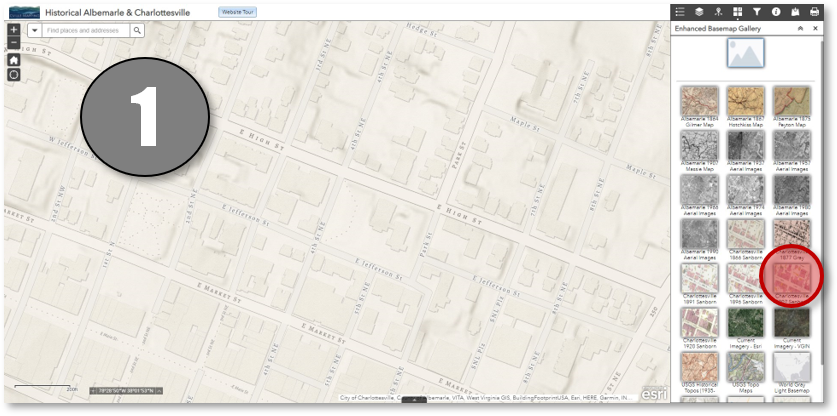
The basemap gallery widget allows you to change the map’s background. By default the map uses a modern world map styled with an antique appearance. A more modern version is also available. The map background can be changed to current or historical imagery, or to a historical map. Topographic maps and a hillshade (terrain) layer are also available.
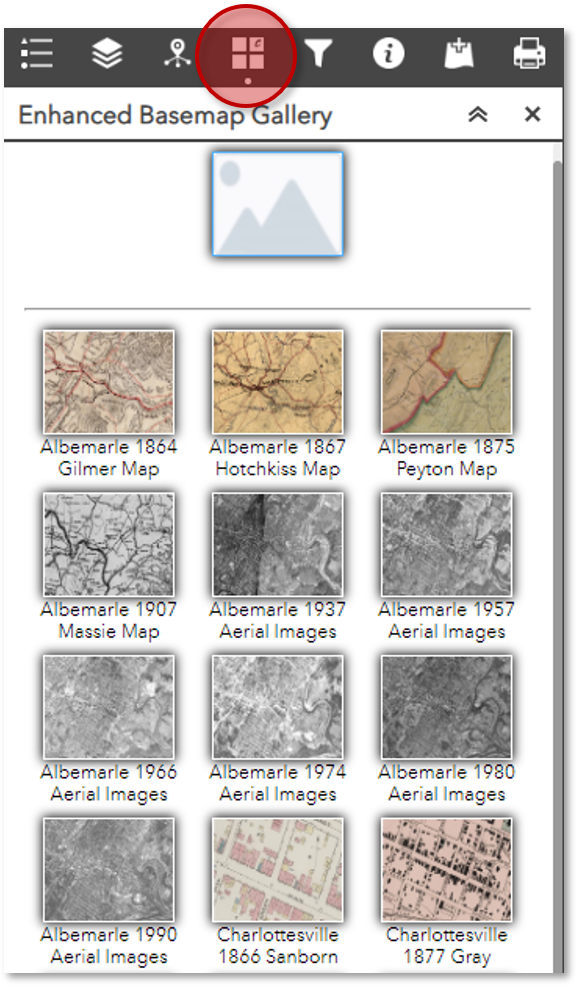
To use the widget simply select one of the basemap icons.
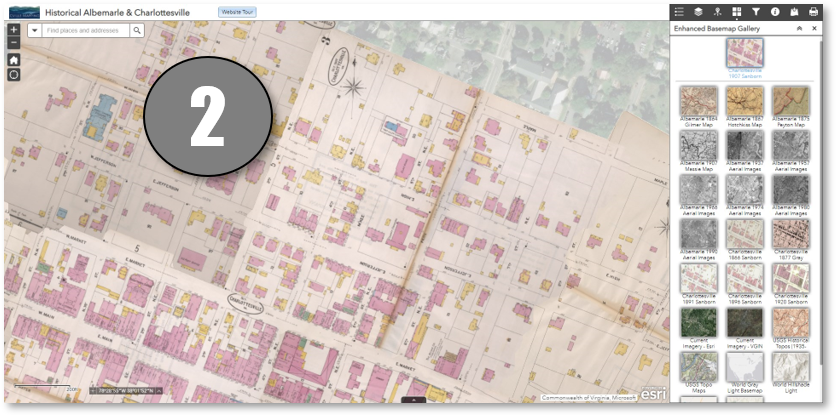
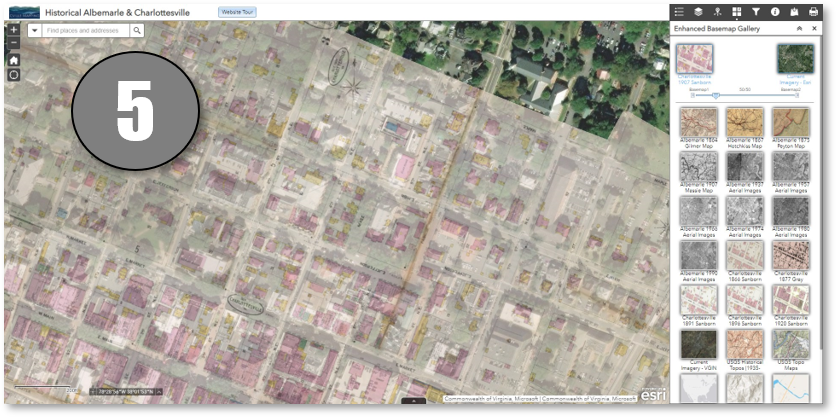
The map will update with the new basemap. In this example I’ve selected a 1907 Sanborn map of Charlottesville, hosted online by the UVA Library Scholars’ Lab.
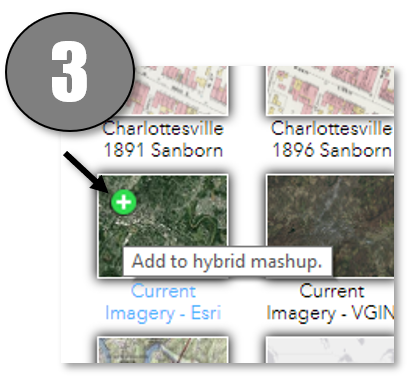
Now hover over another basemap icon and you’ll see a green plus sign appear.
Clicking the plus sign will add the map to the top of the widget. Underneath both map icons is a slider bar. Move the slider back and forth to adjust the transparency between the two layers. If the slider were all the way to the left, the Sanborn map would be completely opaque and you would be unable to see the imagery layer. Sliding the slider to the right would make the Sanborn map disappear and only the imagery would be visible.
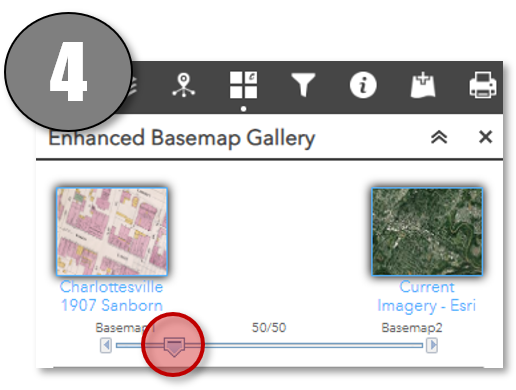
Moving the slider somewhere in the middle will allow you to see both basemap layers at the same time. Now the modern satellite image is visible underneath the 1907 map.
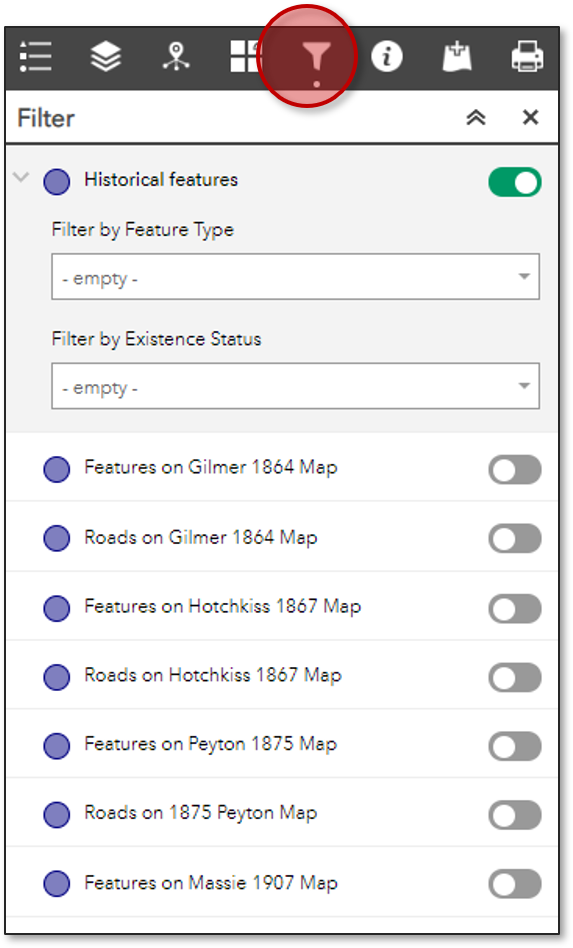
The filter widget is configured with a variety of drop downs and pre-built queries to limit what appears on the map. You can select by feature type (mill, church, house, etc) or existence status (Currently Exists, Does Not Exist, Possibly Exists, Unknown).
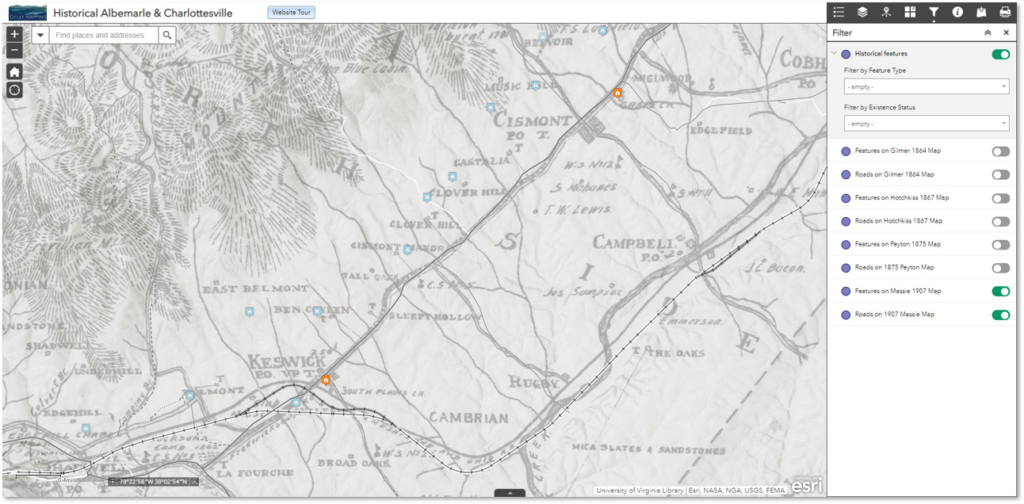
There are also pre-built filters to toggle features on/off based on which historical maps they appear. This makes for another fun way to blend the old and the new. In the example below I’ve used the basemap widget to display the 1907 Massie map over a modern terrain layer (it really makes Massie’s terrain hachure marks “pop”). Then I’ve used the filters for the Massie map to limit the historical features and roads to only those features also on the Massie map.
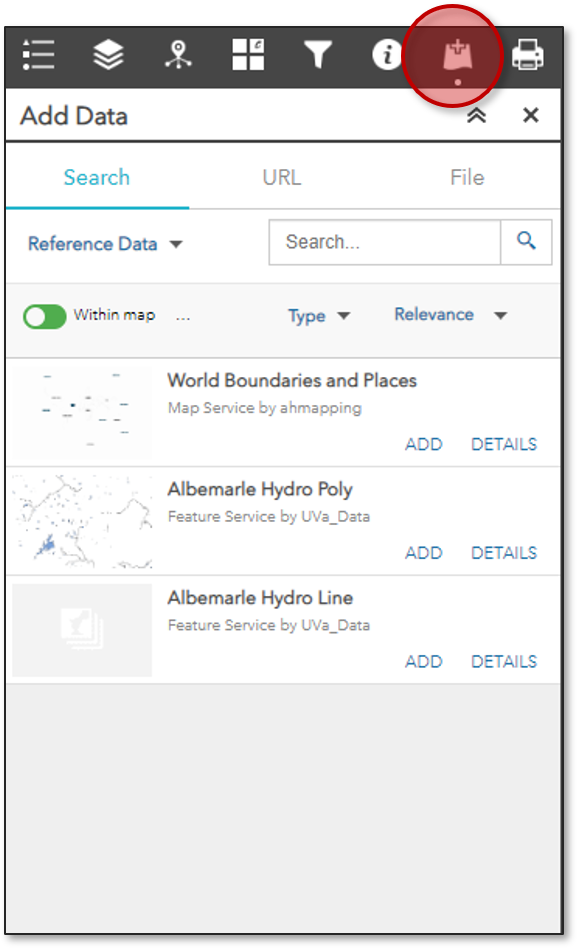
The add data widget lets you put additional content on the map. This includes other data layers in ArcGIS Online, external web services, or local files. Several curated services that may be of interest, including modern roads, boundaries, and water features are available when the widget first opens.
The attribute table widget allows you to view details about all the features in the map in tabular format. By default it’s hidden at the bottom of the screen. Click the up arrow to open the attribute table.
At the top of the attribute table are tabs for each layer in the map. Each row in the table represents a single feature on the map. Each column represents an attribute, or piece of information, about that feature. Clicking the column header allows you to sort in ascending or descending order based on the values in that column, similar to Excel. At the top left is a button that says “Options”.
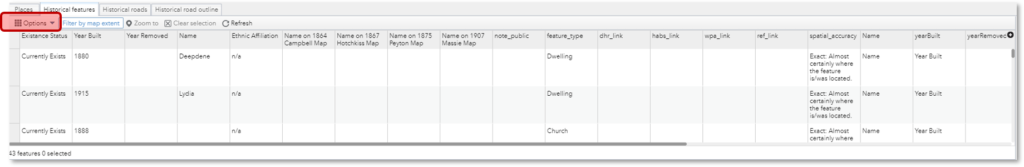
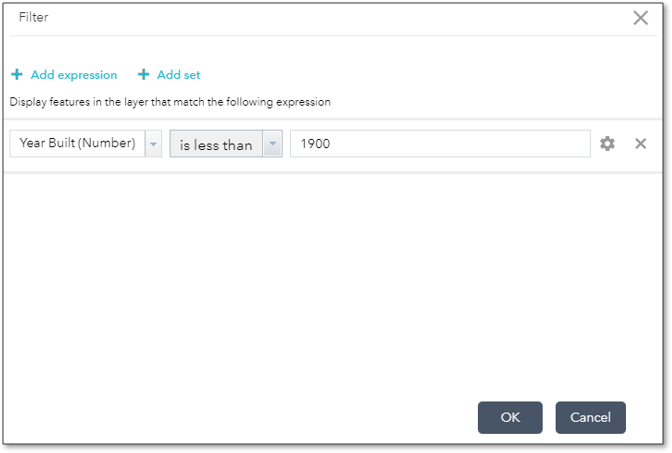
This menu gives you two helpful…options (for lack of a better word). You can turn columns on and off to make the table easier to manage. You can also select “Filter” and build your own boolean queries, like a more powerful version of the Filter widget. In the example below I’ve set a filter to display only buildings constructed prior to 1900.
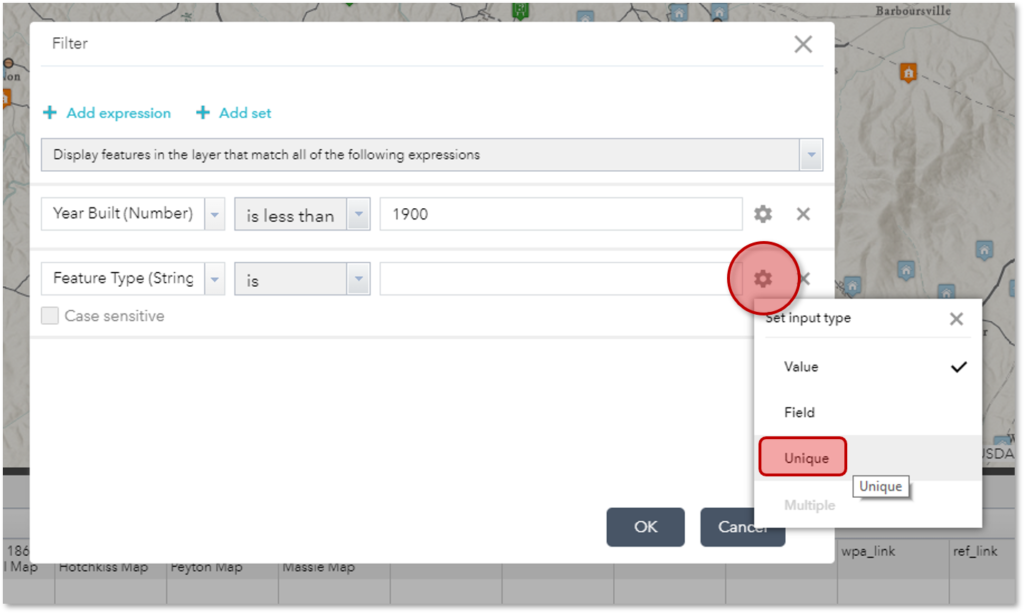
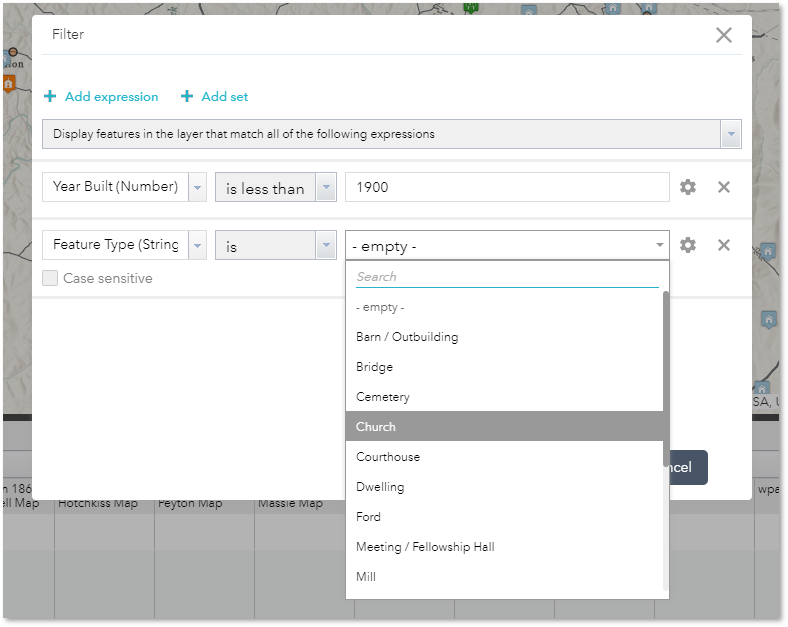
This is a powerful feature that gives you maximum control over what gets displayed on the map. You can create an additional filter by selecting “Add expression” near the top of the window. In the below example I’ve set my input field to “Feature Type”. By clicking the gear icon at the end of the line a drop down expands. For this example I’ll select “Unique”
This creates a drop down list of all the values available in the “Feature Type” field. I’ll select “Church”.
If I were to click “OK” my map would now show only churches built before 1900. This is because the filters are using the default option of “Display features in the layer that match all of the following expressions.”
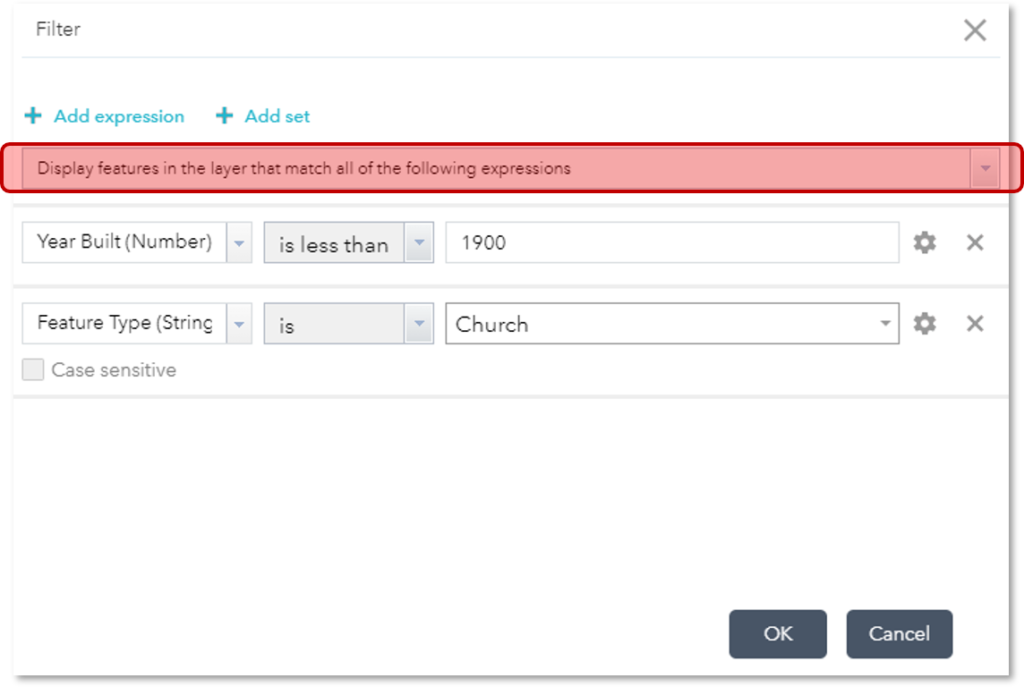
If I selected that drop down and picked the other option, “Display features in the layer that match any of the following expressions” I would see either buildings constructed before 1900 or churches built at any time.
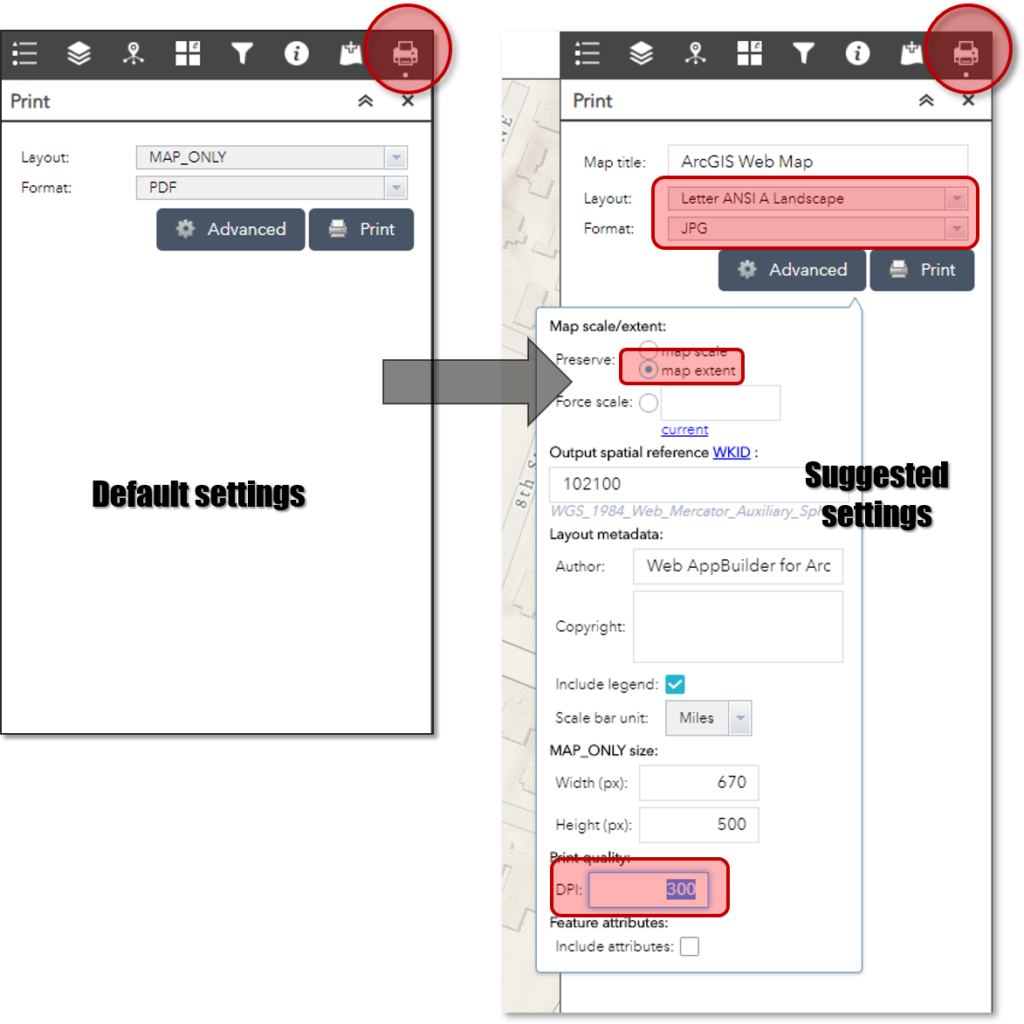
The print widget creates a static graphic of whatever is on the screen. The default settings don’t create the best result, so I recommend these settings:
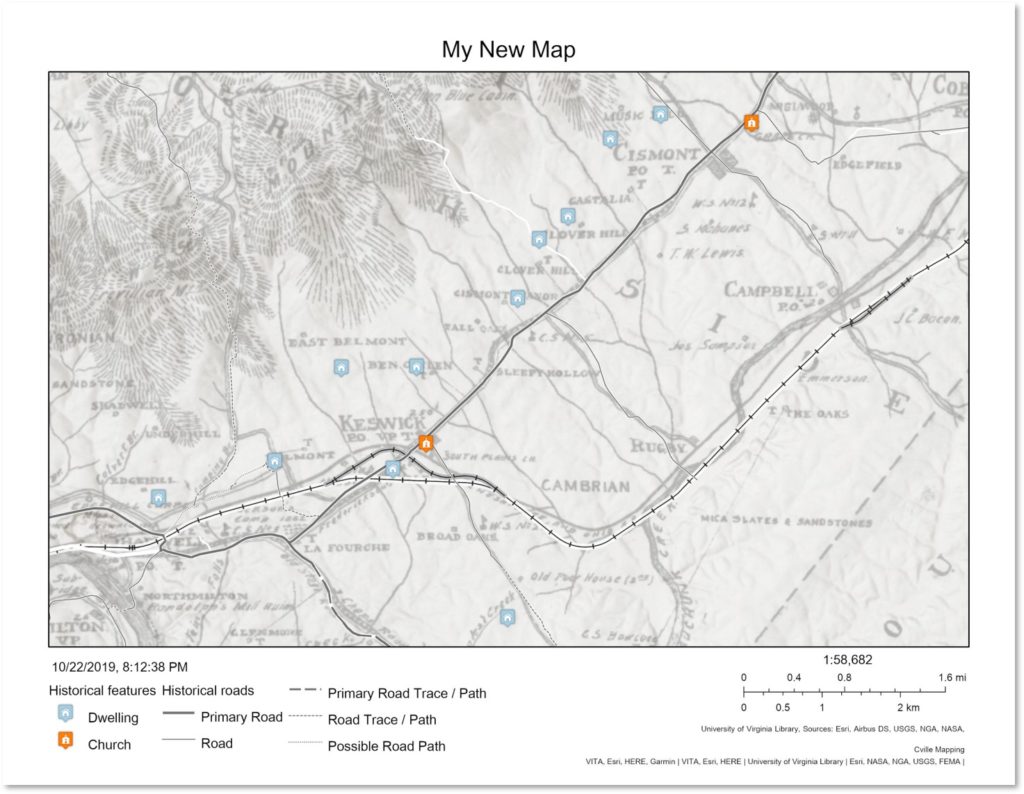
The output is a graphic that can be saved for later reference or printed and taken on trips to the Court House or Library of Virginia.
Disclaimers
This data is provided for informational purposes only. Data layers were compiled from various sources and are believed to be accurate, but accuracy is not guaranteed. This data is provided without any warranty, expressed or implied, including but not limited to, any warranty as to the accuracy of the data, merchantability, or fitness for a particular purpose. Users should verify the data is accurate and appropriate for their own uses.
Please respect private property and do not trespass or attempt to visit any historical site without obtaining prior permission.
Credits
Data layers and information have come from the following sources:
- Albemarle County Office of Geographic Data Services
- Central Virginia History Researchers
- Albemarle Charlottesville Historical Society
- Library of Congress
- Library of Virginia
- UVA Albert & Shirley Small Special Collections Library
- UVA Scholars’ Lab
This map also uses two custom capabilities:
- Enhanced Basemap Gallery Widget by Robert Scheitlin
- Mixing IntroJS and Web AppBuilder by Adrián Pérez Beneito
The animated gifs on this page were created using https://ezgif.com/
The mouse icon was designed by FreePik from Flaticon